Using Netdude
- Table of Contents
- Netdude's View of a Trace file
- The Main Window
- A Walk on the Menu Side
- Getting a quick Overview of a Trace
- Navigation in a Trace File
- Trace Area Configuration
- Using Packet Filtering
- Editing Raw Packet Data
- Changing Packet Timestamps, Wire Size, and Capture Size
- Using the Clipboard
- Using Plugins
- Setting Preferences
- Closing Netdude
- Command Line Options
Netdude's View of a Trace file
tcpdump trace files often are huge; files that are Gigabytes in size are not
uncommon. This makes it prohibitive to just blindly load a trace file into
memory when the user opens a trace. Instead, Netdude always only keeps a
small section of the trace in memory [1], allowing you to jump to arbitrary locations
in the trace based on timestamps and percentage offsets (as explained
later in more detail).
Since Netdude allows the user to add and delete packets, it is not enough
to just mmap() the trace file. Rather, it keeps track
of the manipulations
the user performs and swaps out modified trace parts when the user jumps
to a different part in the trace. When an operation is performed on all
packets in the trace, a new copy of the trace is created in a configurable
scratch space area, merging currently existing modified trace parts
back into a new consolidated temporary trace.
The Main Window
Here's a screenshot of Netdude's main window with two trace files open.
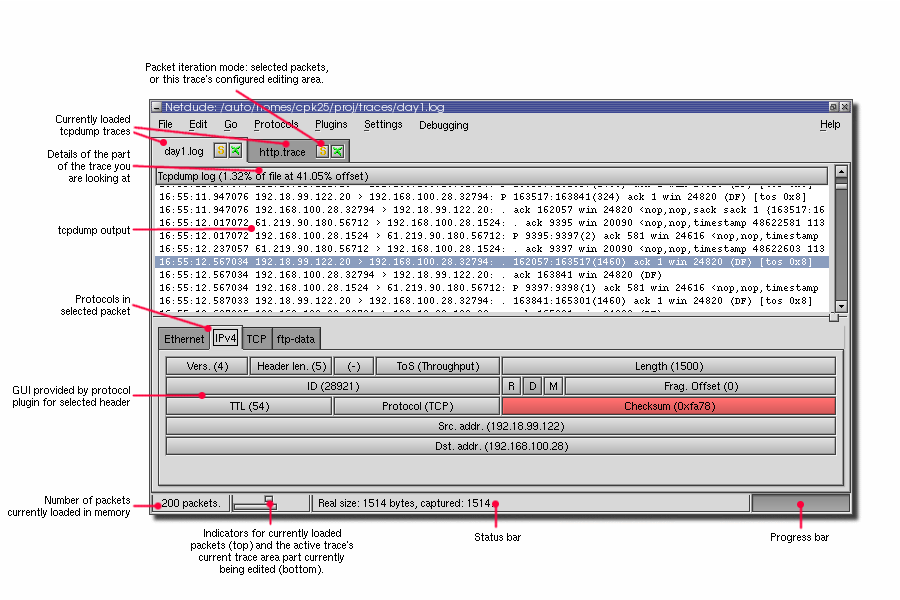
Netdude's main window.
Most things should be obvious -- the GUI is a regular multi-document interface. The menus allow quick access to frequently-used features. Trace files are displayed in a notebook widget, each trace being displayed in its own tab, labeled with the trace's file name and two buttons. The right one is the close button, green while the trace is unmodified and turning red when packets get modified. The left button sets the packet iteration mode for a trace. This mode defines the active packet set, that is, the set of packets to which future packet operations are applied. There are two such modes:
Selected packets: changes are applied to all packets selected in the GUI.
Trace area packets: changes are applied to all packets that fall within the trace's active trace area, which specifies a range in the trace file in terms of start- and end timestamps or fractional offsets. Each trace has such an active trace area. They can be arbitrarily large, ranging from a handful of packets to the entire trace. Details on thjis can be found in the section on Trace Area Configuration.
In each trace tab, the upper part of the window is occupied by the tcpdump output of the
current trace. Left-clicking in the list selects packets, right-clicking
pops up the Edit menu as a shortcut. The protocol headers contained in a packet
are listed as tabs in the lower part, in nesting order from left to
right. You can look at and edit the protocols by clicking on the
corresponding tab.
Packets can be filtered, either manually by selecting 'Edit->Filter' or 'Edit->Unfilter', or by applying a previously created filter to a set of packets. Filtered packets are still displayed, but in a brighter color. When a trace file is saved to disk, all filtered packets are dropped. For more details on filtering packets, see the Section on Filtering.
By clicking on the buttons in the lower part of the window you can edit header field values. Changes to fields are applied to packets depending on the packet iteration mode selected for the current trace as explained above.
Each field in a protocol header has a state, and protocol plugins can change these states to indicate certain circumstances. In the protocol plugins shipped with Netdude, incorrect checksums will appear red, while in situations where the correctness of a checksum cannot be determined (e.g., because not all data covered by the checksum is present), it will appear yellow.
The status bar contains four areas, described left to right: the first one shows the number of packets kept in memory. The second indicates the area of the trace currently loaded into memory (in the upper part), and the active trace area of the current trace (in the lower part). Both are displayed relative to the entire trace. By clicking on the indicators, you can jump to a different location, and configure a different trace area, respectively. The third area is general message area. The fourth is a progress bar that shows progress in operations involving packet iterations.
A Walk on the Menu Side
This section gives a quick explanation of each of Netdude's menu items. Forward references are hard to avoid; please consider this section as a reference.
The File Menu
This menu is mainly used to create, open, and save trace files.
New creates an empty, new trace with a dummy title. You can then populate this empty trace by pasting packets from other traces into it. There are two things to keep in mind here: (a) you can only paste packets from traces captured on the same kind of link layer device, (b) you cannot save an empty new trace that contains no packets, because pcap requires information about the link layer device on which the packets were captured. This information is provided once you paste packets. If you want to save an empty trace, paste at least one packet and then delete them again.
Open ... asks you for a tcpdump trace file and then opens the trace, loading the first set of packets contained in that trace into memory. The section on Setting Preferences explains how you can configure this number.
Save tries to save the file to disk, using its current name. If no such name has been provided yet, you are asked to provide one and the functionality is the same as in "Save as ...".

Don't overwrite valuable data Currently, no backup copies of the file are made, and no warning dialog is popped up when you save a file. Make sure you do not need a copy of the original trace file when using this feature.
Save as ... asks you for a new file name and then saves the file to this name. If a file of the given name already exists, you are asked for confirmation to overwrite it.
Info ... shows a dialog containing information about the currently selected trace. See the section on Getting a quick Overview of a Trace for details.
Close closes the currently edited trace, asking for confirmation in case the trace got modified.
The next set of menu items provides quick access to the last handful of edited trace files. If you leave the mouse pointer over one of the entries for a while, a tooltip window shows you the full path to the file.
Exit terminates the application, asking you what to do with any modified unsaved trace files as described in Closing Netdude.
The Edit Menu
This menu is mostly used for manipulating the clipboard. You have to explicitly place packets into the clipboard — just selecting them does not modify the clipboard.
Cut cuts the currently selected packets out of the current trace and places them into the clipboard.
Copy copies the currently selected packets from the current trace into the clipboard.
Paste pastes the packets currently contained in the clipboard into the current trace, at the currently selected. packet.
Delete deletes the currently selected packets from the trace, without modifying the clipboard.
Select all selects all packets in the current trace part.
Unselect all unselects all packets in the current trace part.
Apply Filters ... pops up a dialog that lets you configure the combination of filters to apply to the current trace.
Filter applies the current filter combination to the selected packets.
Unfilter removes any filtering from the currently selected packets.
Trace Areas ... shows a dialog that lets you configure trace areas for use with the current or other trace files. See Section Trace Area Configuration for more information on the concept of trace areas.
The Go Menu
This menu is used for navigating the packets in the current trace part. See the section on Navigation in a Trace File for more information. Some options would be quite useful if applied to the entire trace; this may be added in future versions.
Next Packet jumps to the next packet in the list.
Previous Packet jumps to the previous packet in the list.
Next selected jumps to the next selected packet.
Previous selected jumps to the previous selected packet.
Next with same protocol jumps to the next packet that has the currently selected protocol at the same nesting level.
Previous with same protocol jumps to the previous packet that has the currently selected protocol at the same nesting level.
Next unfiltered jumps to the next packet that is currently not filtered out.
Previous unfiltered jumps to the previous packet that is currently not filtered out.
Go to other Trace Area ... shows a dialog that allows you to jump to a different area in the trace. Any modifications made to the currently loaded packets will be saved to disk.
The Protocols Menu
This menu provides functionality implemented by the installed protocol plugins and hence varies from installation to installation. Features provided by the protocol plugins included in the Netdude package include checksum correction for ICMP, IPv4, TCP, and UDP. Also, the IPv4 plugin allows you to fragment and reassemble packets.
The Plugins Menu
This menu provides functionality implemented by the installed feature plugins and hence varies from installation to installation. The main feature provided by the feature plugins included in the Netdude package is a checksum fixer that operates on the selected packets and walks the protocols contained in each of those packets, from the innermost to outermost, correcting any checksums as far as the installed protocol plugins provide this functionality.
The Settings Menu
This menu provides a means to configuring various aspects of the application
Configure Filters ... shows a dialog that lets you create new packet filters. See the section on Using Packet Filtering for more details.
Configure Netdude ... shows the preferences dialog as described in Section Setting Preferences.
The Debugging Menu
Please note that this menu is only available if your Netdude was built with debugging support enabled. This menu allows you to enable/disable debugging output for the various components of the application.
The About Menu
Finally, this menu provides information about your Netdude and the installed plugins.
About ... shows a dialog containing the version number, the date of the last modification to the source code for that version, and a list of authors and contributors.
About Plugins provides a menu that is populated by the installed feature plugins. Each menu item provides an information dialog for a plugin.
About Protocols provides a menu that is populated by the installed protocol plugins. Each menu item provides an information dialog for a plugin.
Getting a quick Overview of a Trace
To get a quick overview of a trace, load and select it, then click on 'File->Info'. You will get a dialog with content similar to the following:

Netdude's trace information dialog.
Navigation in a Trace File
Netdude allows you to jump to other packets in a trace file in a number of different ways. Within the currently loaded part of the trace, you can jump to the
Next/Previous Selected Packet by using either 'Go->Next selected' or 'Go->Previous selected'.
Next/Previous Packet with same Protocol: depending on the currently selected protocol type and nesting level, Netdude will attempt to jump to the next/previous packet that contains the same protocol at the same nesting level, skipping filtered packets. Use 'Go->Next with same protocol' or 'Go->Previous with same protocol' or the corresponding shortcuts, respectively. This is most useful for browsing packets in the current trace part, as it makes it easier to follow traffic flows.
Next/Previous unfiltered Packet: using 'Go->Next unfiltered' and 'Go->Previous unfiltered', you can jump to the next/previous packet that is not currently filtered out.

Netdude's trace navigation dialog.
The dialog allows you to jump to other parts in the trace in three ways:
In time: in the upper part of the dialog, you see the start and end timestamps of the trace. After selecting the notebook tab labeled 'Time', you can enter any timestamp within this range directly, or by dragging the scrollbar to the timestamp you desire. After that, click on 'Jump as specified' to perform the actual jump.
In space: after clicking on the notebook tab labeled 'Space', you can drag the scrollbar to a relative offset in the trace (e.g., 75% would mean a jump to the point in the trace located at three quarters of the trace file's size). Again, clicking on 'Jump as specified' performs the actual jump.
Blockwise: To simply browse in the trace, just click on 'Previous block' or 'Next block'. The jumps are performed directly, so there is no need to click 'Jump as specified' as in the other cases.
Trace Area Configuration
Much like layers in a graphics program, you can create a set of trace areas and set them selectively for individual traces. This is all done in the trace area configuration dialog that can be opened by selecting 'Edit->Trace Areas...' or by clicking on the trace area indicator in the status bar.

Netdude's trace area configuration dialog with two configured areas.
The dialog is used as follows. The top left area shows some characteristics of the current trace, for orientation. The list on the right contains your configured trace areas, and the area in the bottom left is used for the area configuration itself. To create a new area, click 'New' and enter a name for the trace area. You can choose whether you want a time- or space limited area by selecting the appropriate tab. Then, adjust the boundaries as you see fit. By pressing 'Apply' you update the boundaries in the edited trace area. The other three buttons set the edited area to the area occupied by the packets loaded into memory, the trace's current area, or the entire trace, respectively. To set a configured trace area as the active one for the current trace, press 'Set' — you will see the trace area indicator in the status bar update. Finally, use the 'Delete' button to erase trace areas you do not longer need.
Using Packet Filtering
The ability to filter packets is essential for performing reasonable packet modifications. Netdude has a generic filter API that allows plugins to register their own filters, while still allowing the user to easily manipulate these filters through the GUI.
There are two things to keep in mind about filtered packets:
No matter what packet iteration mode is in use, packet modifications are never applied to filtered packets.
When a trace file containing filtered packets is saved, all filtered packets are dropped.
Netdude's filter creation dialog (back), ready to create a new BPF filter (front).
An instance of the filter application dialog.

After applying the FTP data filter.
Editing Raw Packet Data
Whenever Netdude encounters data that is not specifically interpreted by some protocol plugin, the data is displayed using Netdude's payload editor, in a separate tab. Netdude tries to give the tab a meaningful label by looking at TCP or UDP port numbers when available. If this fails, the tab reads "(rest)".
This editor supports two modes of operation -- hex and ASCII. In hex mode, it works like usual hex editors. An image of an editing session is shown below:

Editing raw data using the hex editor.
By clicking into the editor field, the cursor is placed either over a hex digit or the corresponding ASCII display on the right. The actual cursor is blue, the corresponding indicator in the other display part in a bright gray [2].
But Netdude's payload editor is better than that. For normal text, editing using the hex editor is cumbersome. You can use ASCII mode in those situations -- here the editor behaves more like a normal text editor. You can literally type up packet content. However, be aware that when typing in more text than existed previously, some text is dropped at the end of the packet, as the size of the packet is not actually increased.

Editing raw data using the ASCII editor.
There's one point that needs to be addressed when editing arbitrary binary data using the ASCII characters: unprintable characters and the null character, which normally delimits character strings. These characters are displayed as follows:
The null character is displayed using ASCII code 0xf8, which is a circle with a diagonal line crossing it diagonally, thus looking a bit like a "0".
Other nonprintable characters (those smaller than 0x20 and in the 0x7f - 0xa0 range, except newlines) are printed using a centered little dot.
When editing data in ASCII mode, the size of the data chunk you are modifying is not increased. This means that for every excess character you are adding, there is a character falling off the end and lost. You can see the affected characters displayed in a lighter hue, see the above screenshot for an example.
 | Modifications made to packets using the payload editor are always exclusively applied to the current packet, regardless of the trace's current packet iteration mode. |
|---|---|
If you want to change the size of a packet (for example, in order to gain more room in the payload section), you need to do so first, and then edit the space given. See the next section for how to adjust a packet's size [3]
Changing Packet Timestamps, Wire Size, and Capture Size
With release 0.4.8, Netdude gained the ability to modify packet metadata, namely the packets' timestamps as well as wire size and capture length. We'll discuss them in turn.
To adjust a packet's timestamp, select it in the tcpdump output, and click on the packet's "pcap" protocol tab. Adjust the seconds and microseconds as desired, and you're done. If you'd like to change the timestamp on a large number of packets, we suggest writing a libnetdude feature plugin.
To change the packet size, you need to understand that the notion of packet size is not unique. In the context of pcap trace files, there are two meanings that are of particular importance. The first one is the wire size, i.e., the full size of the packet, possibly including the link-layer header depending on the capture mode. The second one is the capture size, i.e., the part of the packet that was actually captured by pcap when the trace was recorded.
Netdude lets you edit both of these separately, by clicking the respective fields in the "pcap" protocol tab. When doing so, the following actions are taken:
When growing the wire size, the packet headers of the protocols contained in the modified packet are updated as necessary. This is implemented through hooks in the various protocol plugins, which know how to properly reflect size changes in their header fields. Currently, these hooks are implemented to packet-local scope. For example, when growing a UDP datagram, the IP and UDP length fields will be updated.
When shrinking the wire size, the packet headers are likewise updated as necessary. Once the wire size falls below the capture size, the capture size is likewise reduced, as described below.
When shrinking the capture size, the data buffer available for the whole buffer is shrunk accordingly, without any other changes.
When growing the capture size, the data buffer available for the whole buffer is grown accordingly, without any other changes, unless you grow the capture size beyond the packet's wire size. In that case, the wire size grows as well, and the growth is automatically reflected in the packet headers.
| The protocol plugin hooks that reflect packet size changes in the headers do not currently handle TCP streams well. In particular, TCP sequence numbers, are not yet updated in the local packet or in the packets following the modified packet. So if you want to change the size of TCP payloads, make sure you understand what you are doing, or even better, send patches for code that correctly patches up the flow's following packets... |
|---|---|
Using the Clipboard
Netdude provides a single clipboard area for temporary storing
packets and moving them around between traces. Just cut or copy packets
into the clipboard using the 'Edit->Copy', 'Edit->Cut' or the same
entries in the context menu obtainable by using right-click in the packet
list. The clipboard also serves an important other purpose: when you are
placing packets in the clipboard, their tcpdump output
is placed in the X cut buffer. Afterwards, pasting in other
applications like editors or email composers will give you the tcpdump output
there.
There is one thing you need to be aware of when using the clipboard
to transfer packets between traces: in tcpdump traces, all packets must
be of the same link-layer type[4].
Therefore, Netdude will prevent
pasting of packets using different link-layer types than the ones
in the packets already contained in a trace, if they differ.
Using Plugins
All registered plugins automatically get a menu item in the Plugins menu. By clicking an item, a plugin is activated. It depends on the plugin implementation whether it matters which packets are selected at that time and what happens next. As an example, the Checksum-Fix plugin that is shipped with Netdude will iterate over all currently selected packets and fix those packets. Then, it writes a little summary line in the status bar.
Activating a plugin.
Setting Preferences
Netdude's preferences dialog is organized in tabs, one per preferences domain. There's always a tab for the Netdude-wide configuration, the rest depends on the protocols and plugins installed [5].
Netdude's preferences dialog.
The options should be pretty obvious. You can specify the tcpdump
binary to use for displaying the tcpdump output, adjust the tcpdump
output, configure the way packet capture timestamps are displayed
and select fonts, among other things.
Closing Netdude
Netdude is one of the few applications that provides an exit dialog that is actually useful, because it gives you precise control over what changes you want to save and which ones you don't care about.

Netdude's exit dialog.
If you have modified any of the currently open traces, Netdude will present the exit dialog shown above. Each unsaved and modified trace is listed with a Save button that provides a way to save that trace. Trace file names you have saved using the dialog are grayed out. You don't need to save any traces of course — when you are sure you've saved everything you need, click the Exit button and Netdude exits.
Command Line Options
Netdude provides the following command line options:
Netdude -- The Network Dump data Displayer and Editor.
USAGE: netdude [OPTIONS] [tracefiles]

  --help, -h, -?           This message.
  --debug, -d              Print debugging output.
  --ludicrous-debug, -dd   More debugging output.
  --ridiculous-debug, -ddd Guess :)
  --prefix                 Installation prefix.
  --include-dir            Prefix directory of header files.
  --cflags                 Preprocessor flags needed to build plugins.
  --plugin-dir             Plugin installation directory.
  --proto-dir              Protocol installation directory.
  --plugins                Lists all successfully registered plugins.
  --version                Prints out version info.
  --version-maj            Prints out major version number.
|